AgentOS Scope OutJoin the waitlist
From raw directory URL to ranked opportunity dossier — every step shipped.
Scope Out crawls PropTech supplier directories, scrapes reviews and pricing signals, scores each product across four dimensions, and hands you a copy-ready dossier — all in a single pipeline.
[ DISCOVER / CRAWL ]
The crawl trigger form accepts any directory URL — starting with Kerfuffle.com. A single click dispatches the ingestion job: pagination handled, rate limits respected, robots.txt obeyed. Live status ticks from queued → running → completed with a product count as listings land.
Skim or Full Analysis Choose listing-only discovery in seconds, or commit to full scrape + score + dossier — decide after you see directory size.
Duplicate Guard Concurrent crawls of the same URL are blocked. Previously seen products are deduplicated automatically.
Configurable Depth Per-domain request rate, user-agent identity, and exponential back-off on 429/503 responses baked in.
Multi-directory Support Add directories beyond Kerfuffle — GetApp PropTech, G2, and more — each with its own crawl frequency.
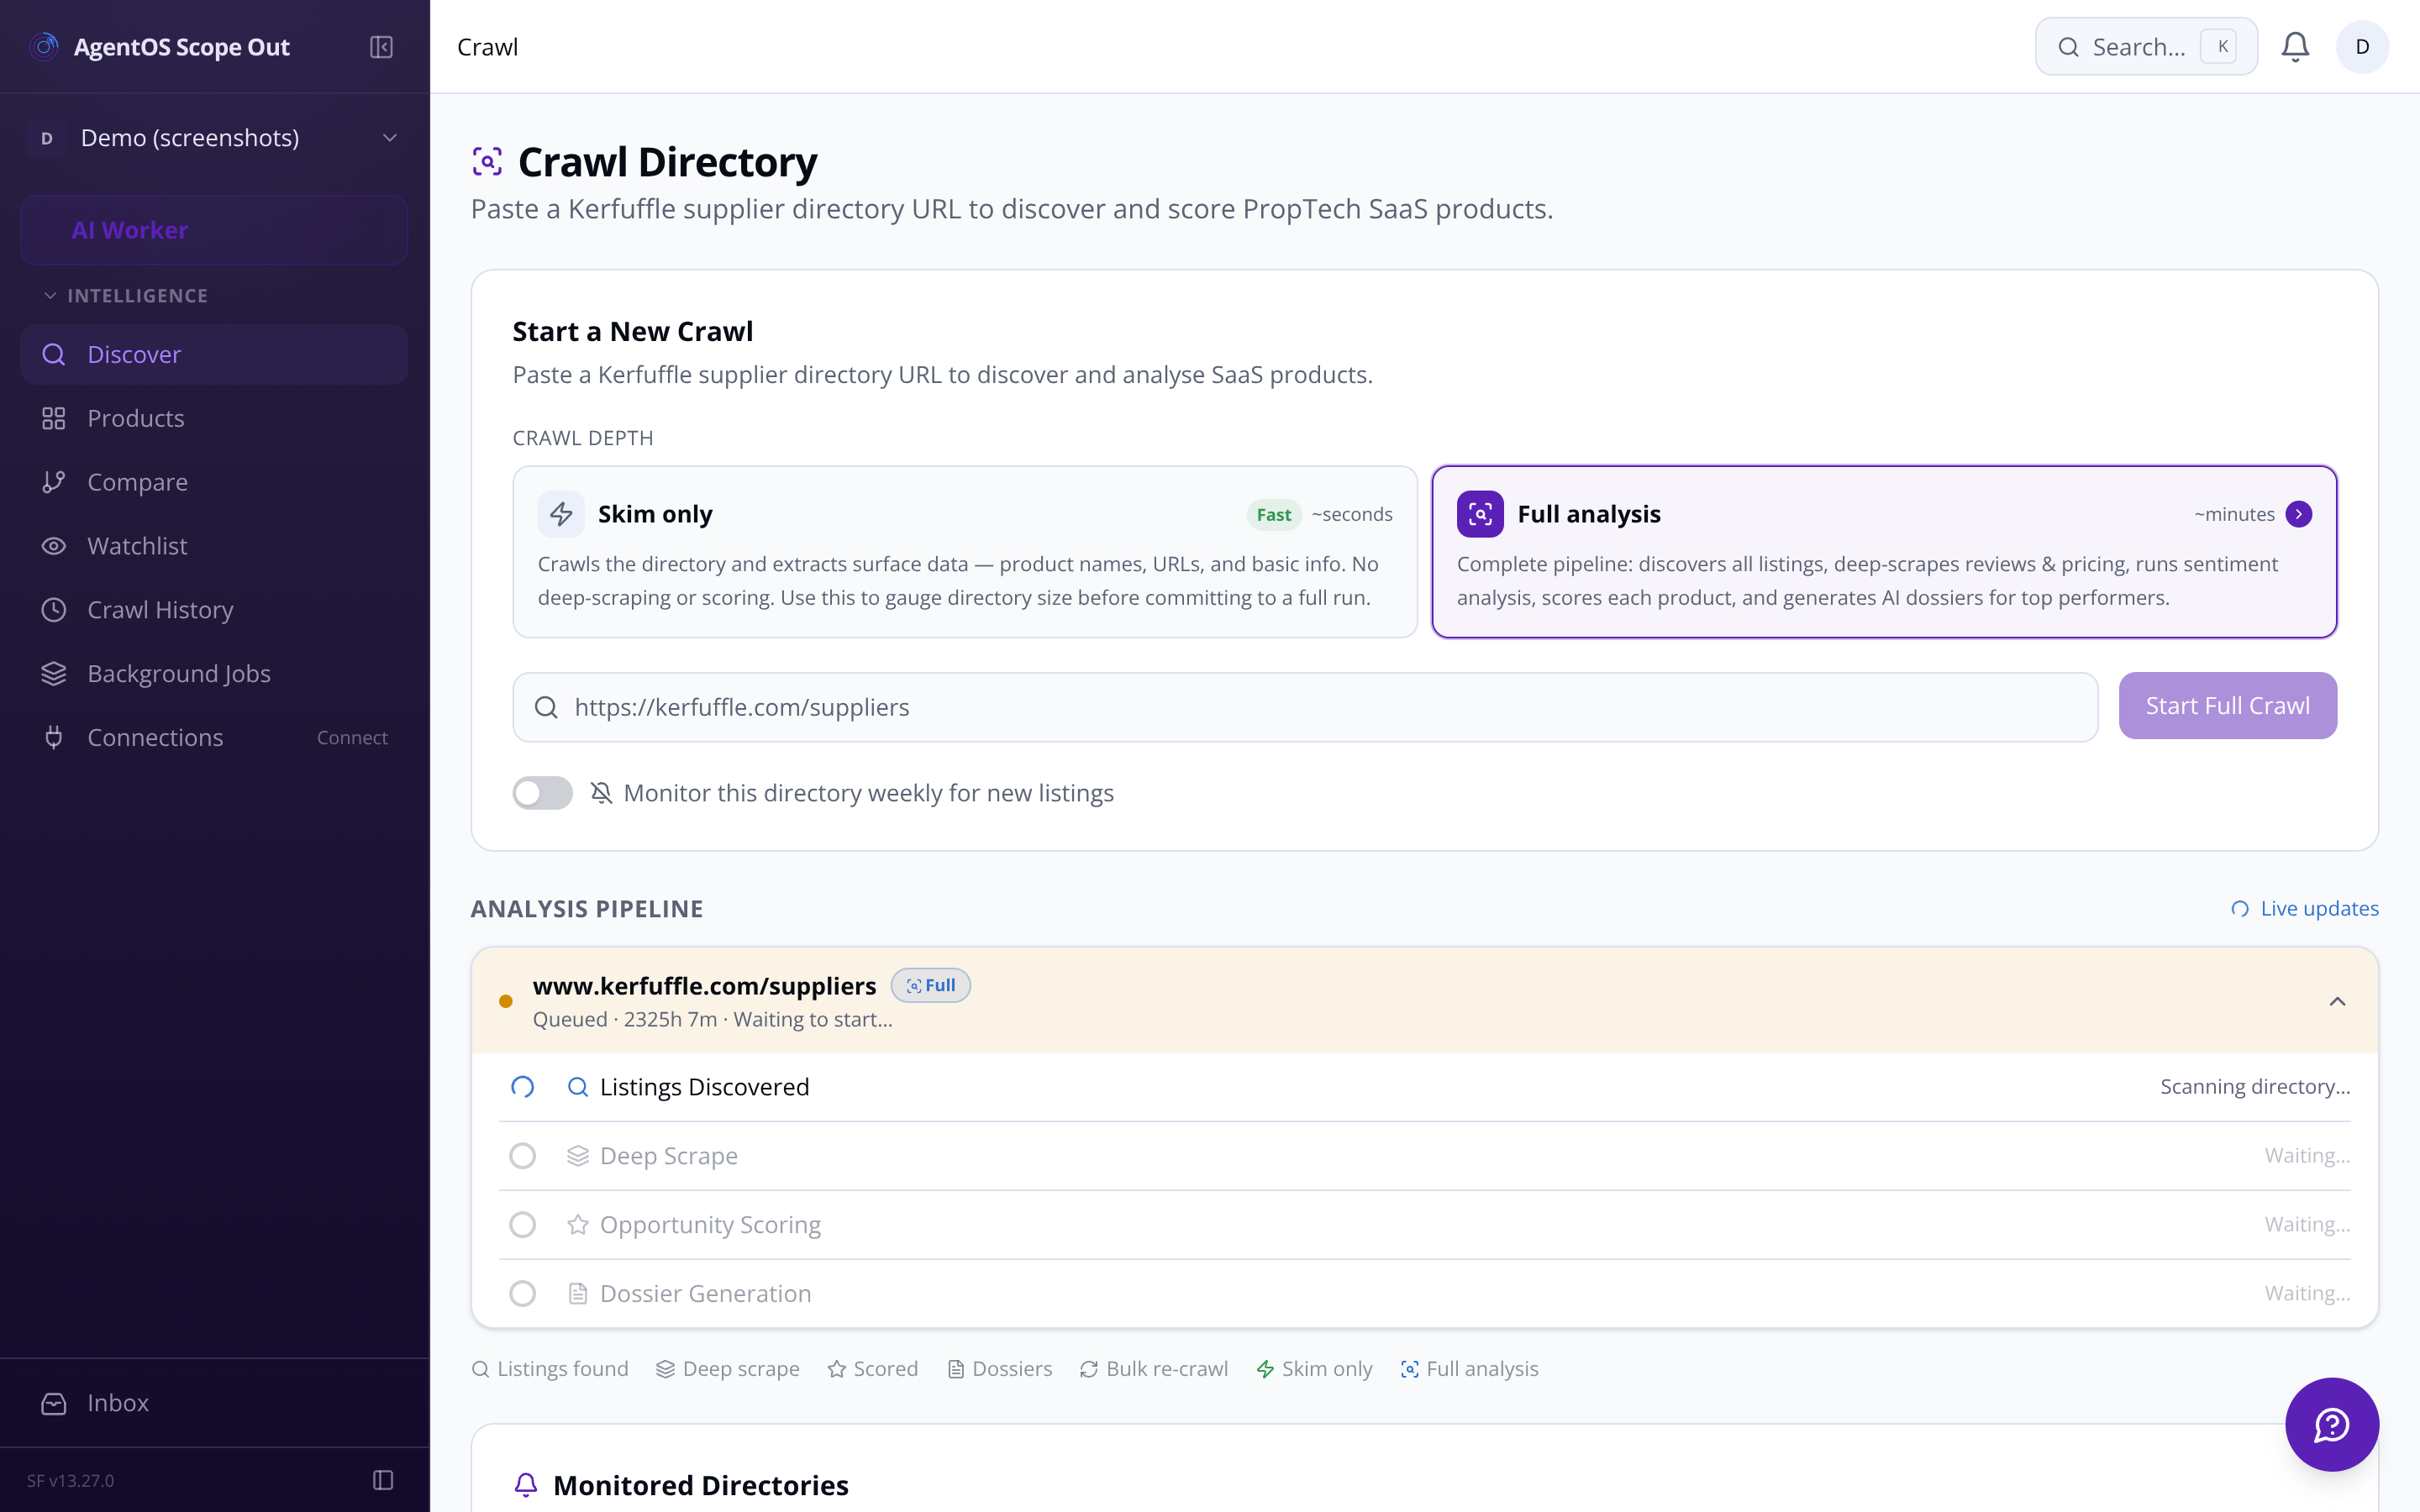
All vendor listings scraped: name, URL, category tags, description. Stored and deduplicated.
Top-N products sent to deep-scrape: star ratings, review text, pricing tier, feature bullets extracted.
LLM evaluates replicability, market demand, revenue potential, and competitive gaps — composite score computed.
Auto-drafted mission statement, prioritised feature list, and competitor weakness analysis — copy to clipboard in one click.
[ TEAM / SHORTLIST / COLLABORATION ]
Mark any product as new, reviewed, shortlisted, building, or archived. Shortlisted products surface in a dedicated Watchlist view. Archived ones disappear from the main table without being deleted.
Any team member can add free-text notes to a product's dossier — timestamped and attributed. Notes thread on the dossier page alongside the AI analysis. No separate document needed.
A weekly email to all allowlisted team members: top 5 new products discovered, top 3 by composite score, and any products whose scores shifted by ±2 points. Configurable on/off per user.
Crawl completion, new product discovery, score movements on shortlisted products, and AI cost threshold breaches all surface as in-app notifications with direct links to the relevant run or dossier.
Access is restricted to the internal team. Questions? Email sf-core-org-support-agentos-scope-out@saas-factory.ai
Email Support[ RANKED DASHBOARD / PRODUCTS ]
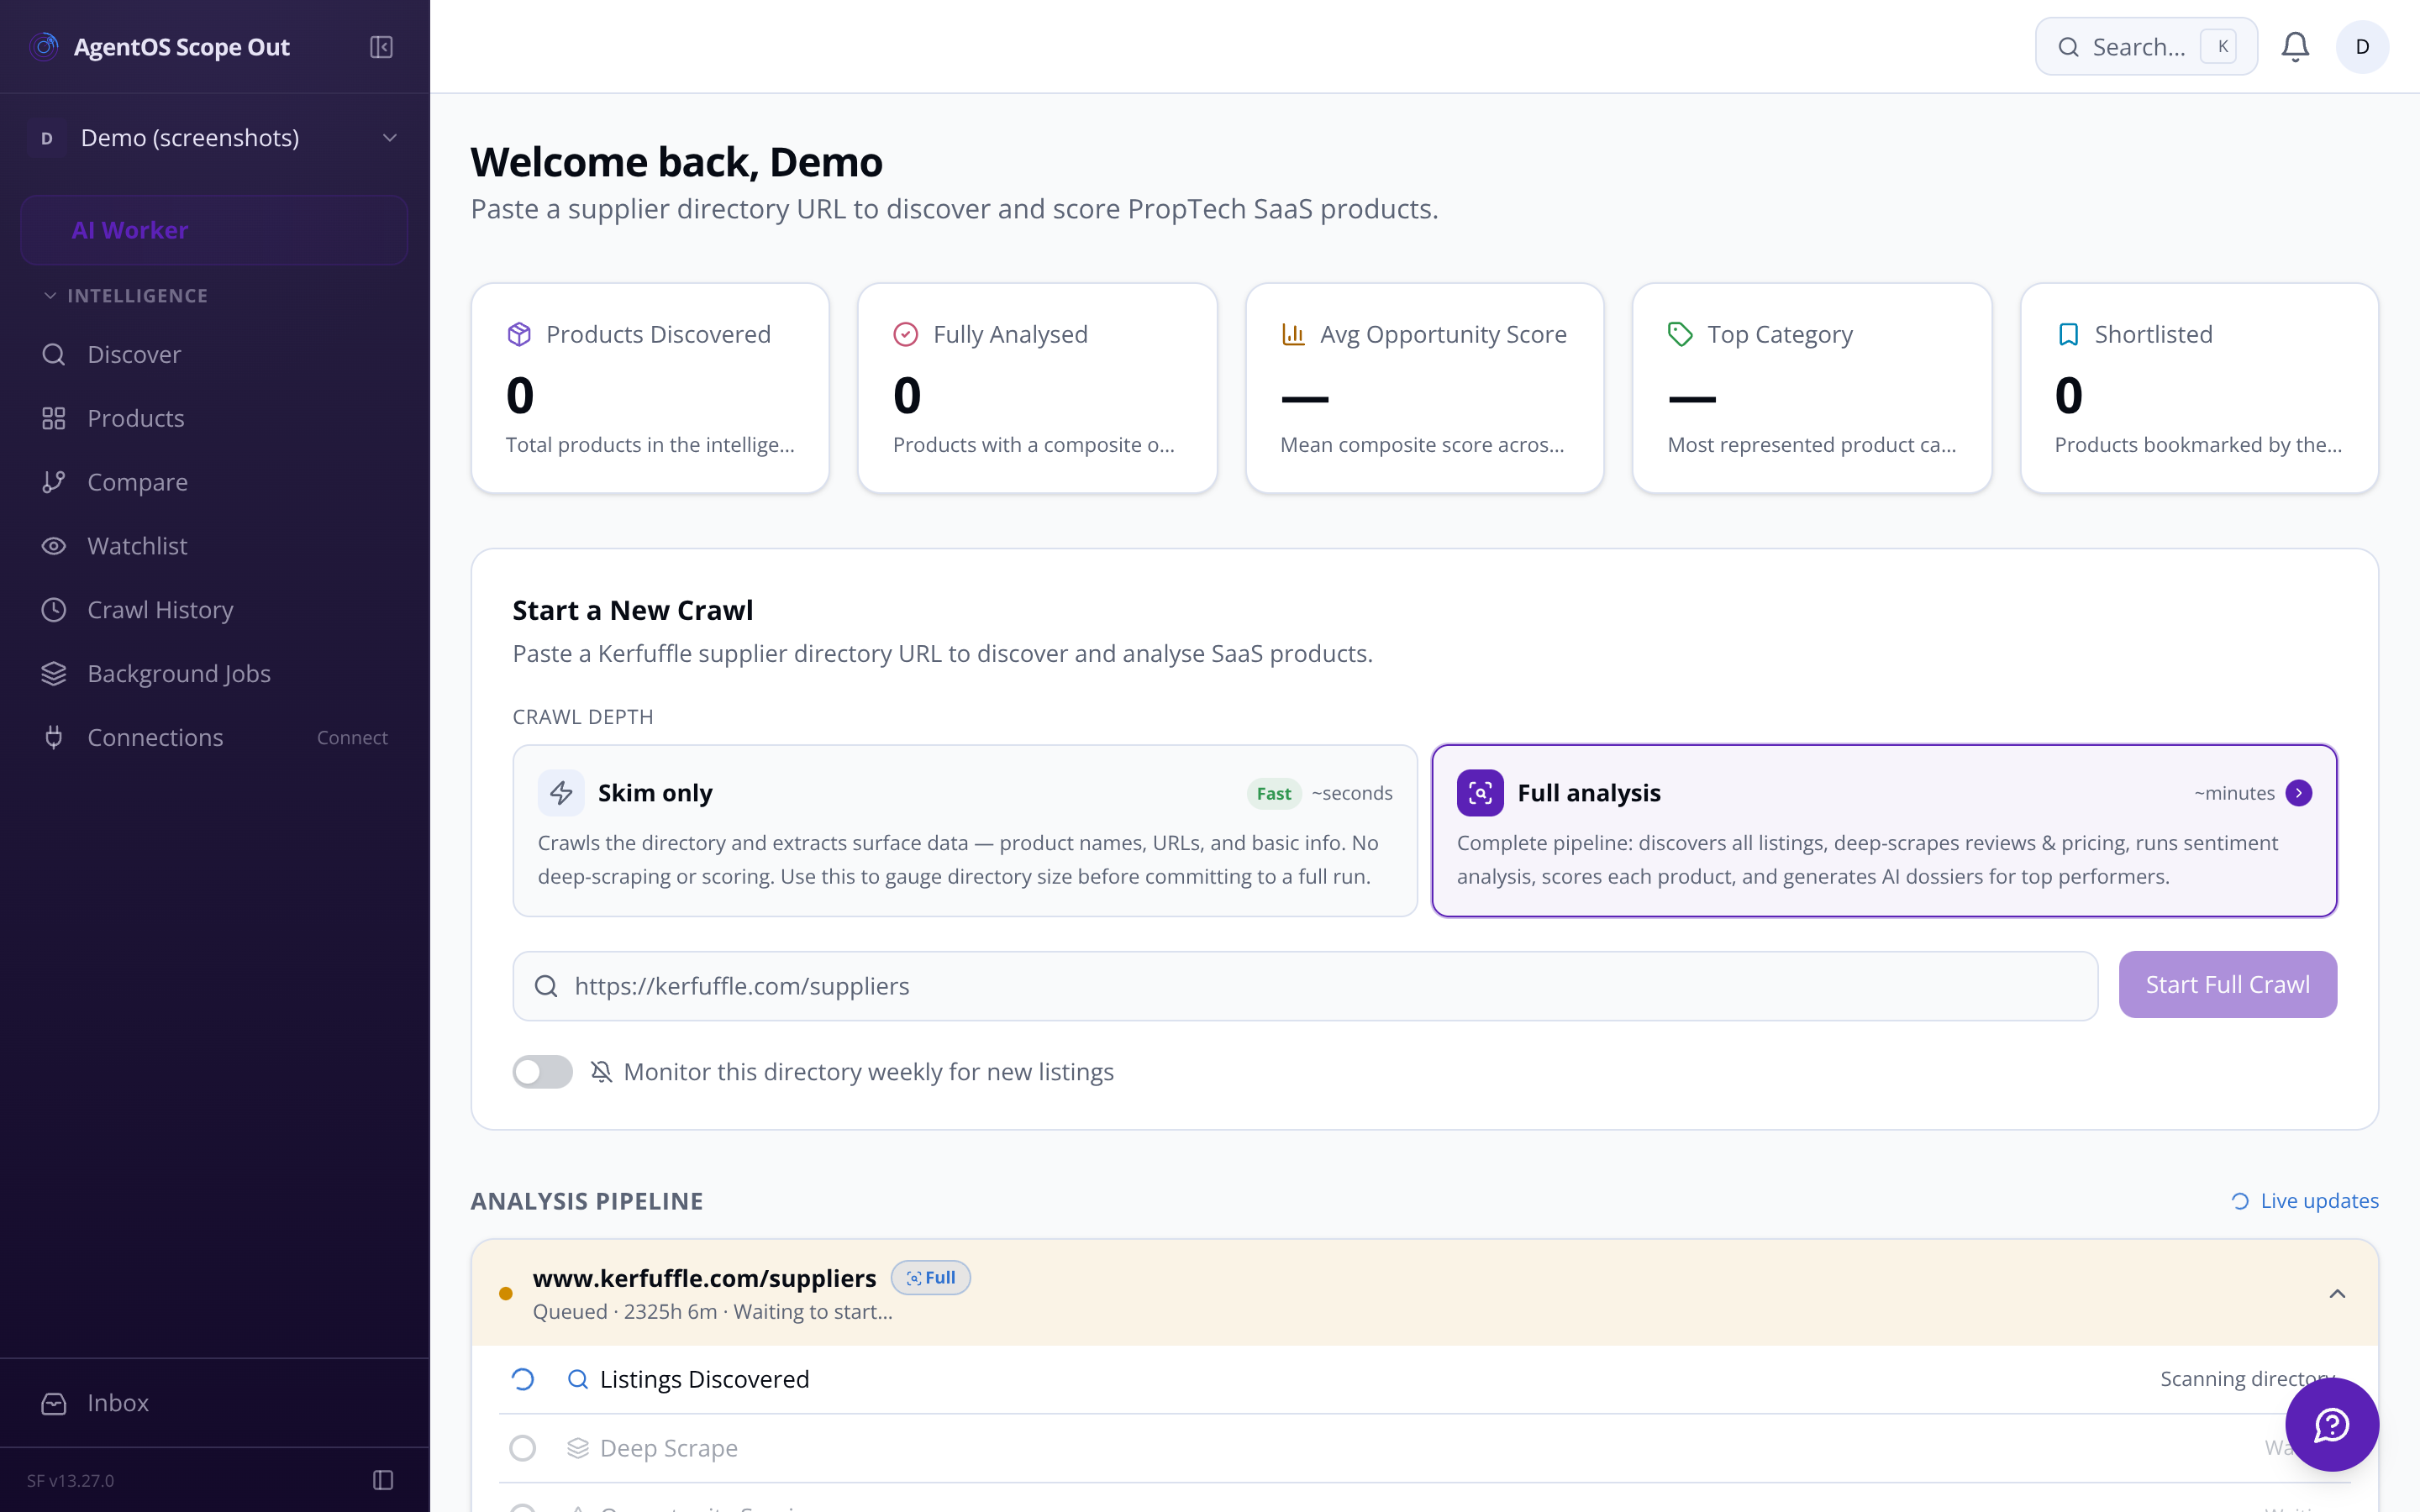
Every analysed product sorted by composite opportunity score. Sort by any column — replicability, revenue potential, review count, pricing tier. Filter by category or score threshold. Share exact filtered views via URL query params. No cards, no carousel — this is a working intelligence tool.
[ AI SCORING / FOUR DIMENSIONS ]
The AI scoring engine passes scraped product data to an LLM and computes four 1–10 scores. Each has a written rationale you can read, not just a number you have to trust.
Replicability (1–10) Can we build this with Next.js, Neon, Inngest, tRPC, Drizzle, Vercel? LLM evaluates data model complexity, real-time needs, integration count, AI requirements.
Market Demand (1–10) Review volume, recency, average rating, and positive/negative sentiment ratio — logarithmically scaled so low review counts still surface real signal.
Revenue Potential (1–10) Pricing tier × PropTech category market size × review-implied adoption. Written rationale includes estimated ARR range for a new entrant.
[ COMPARE / DOSSIER ]
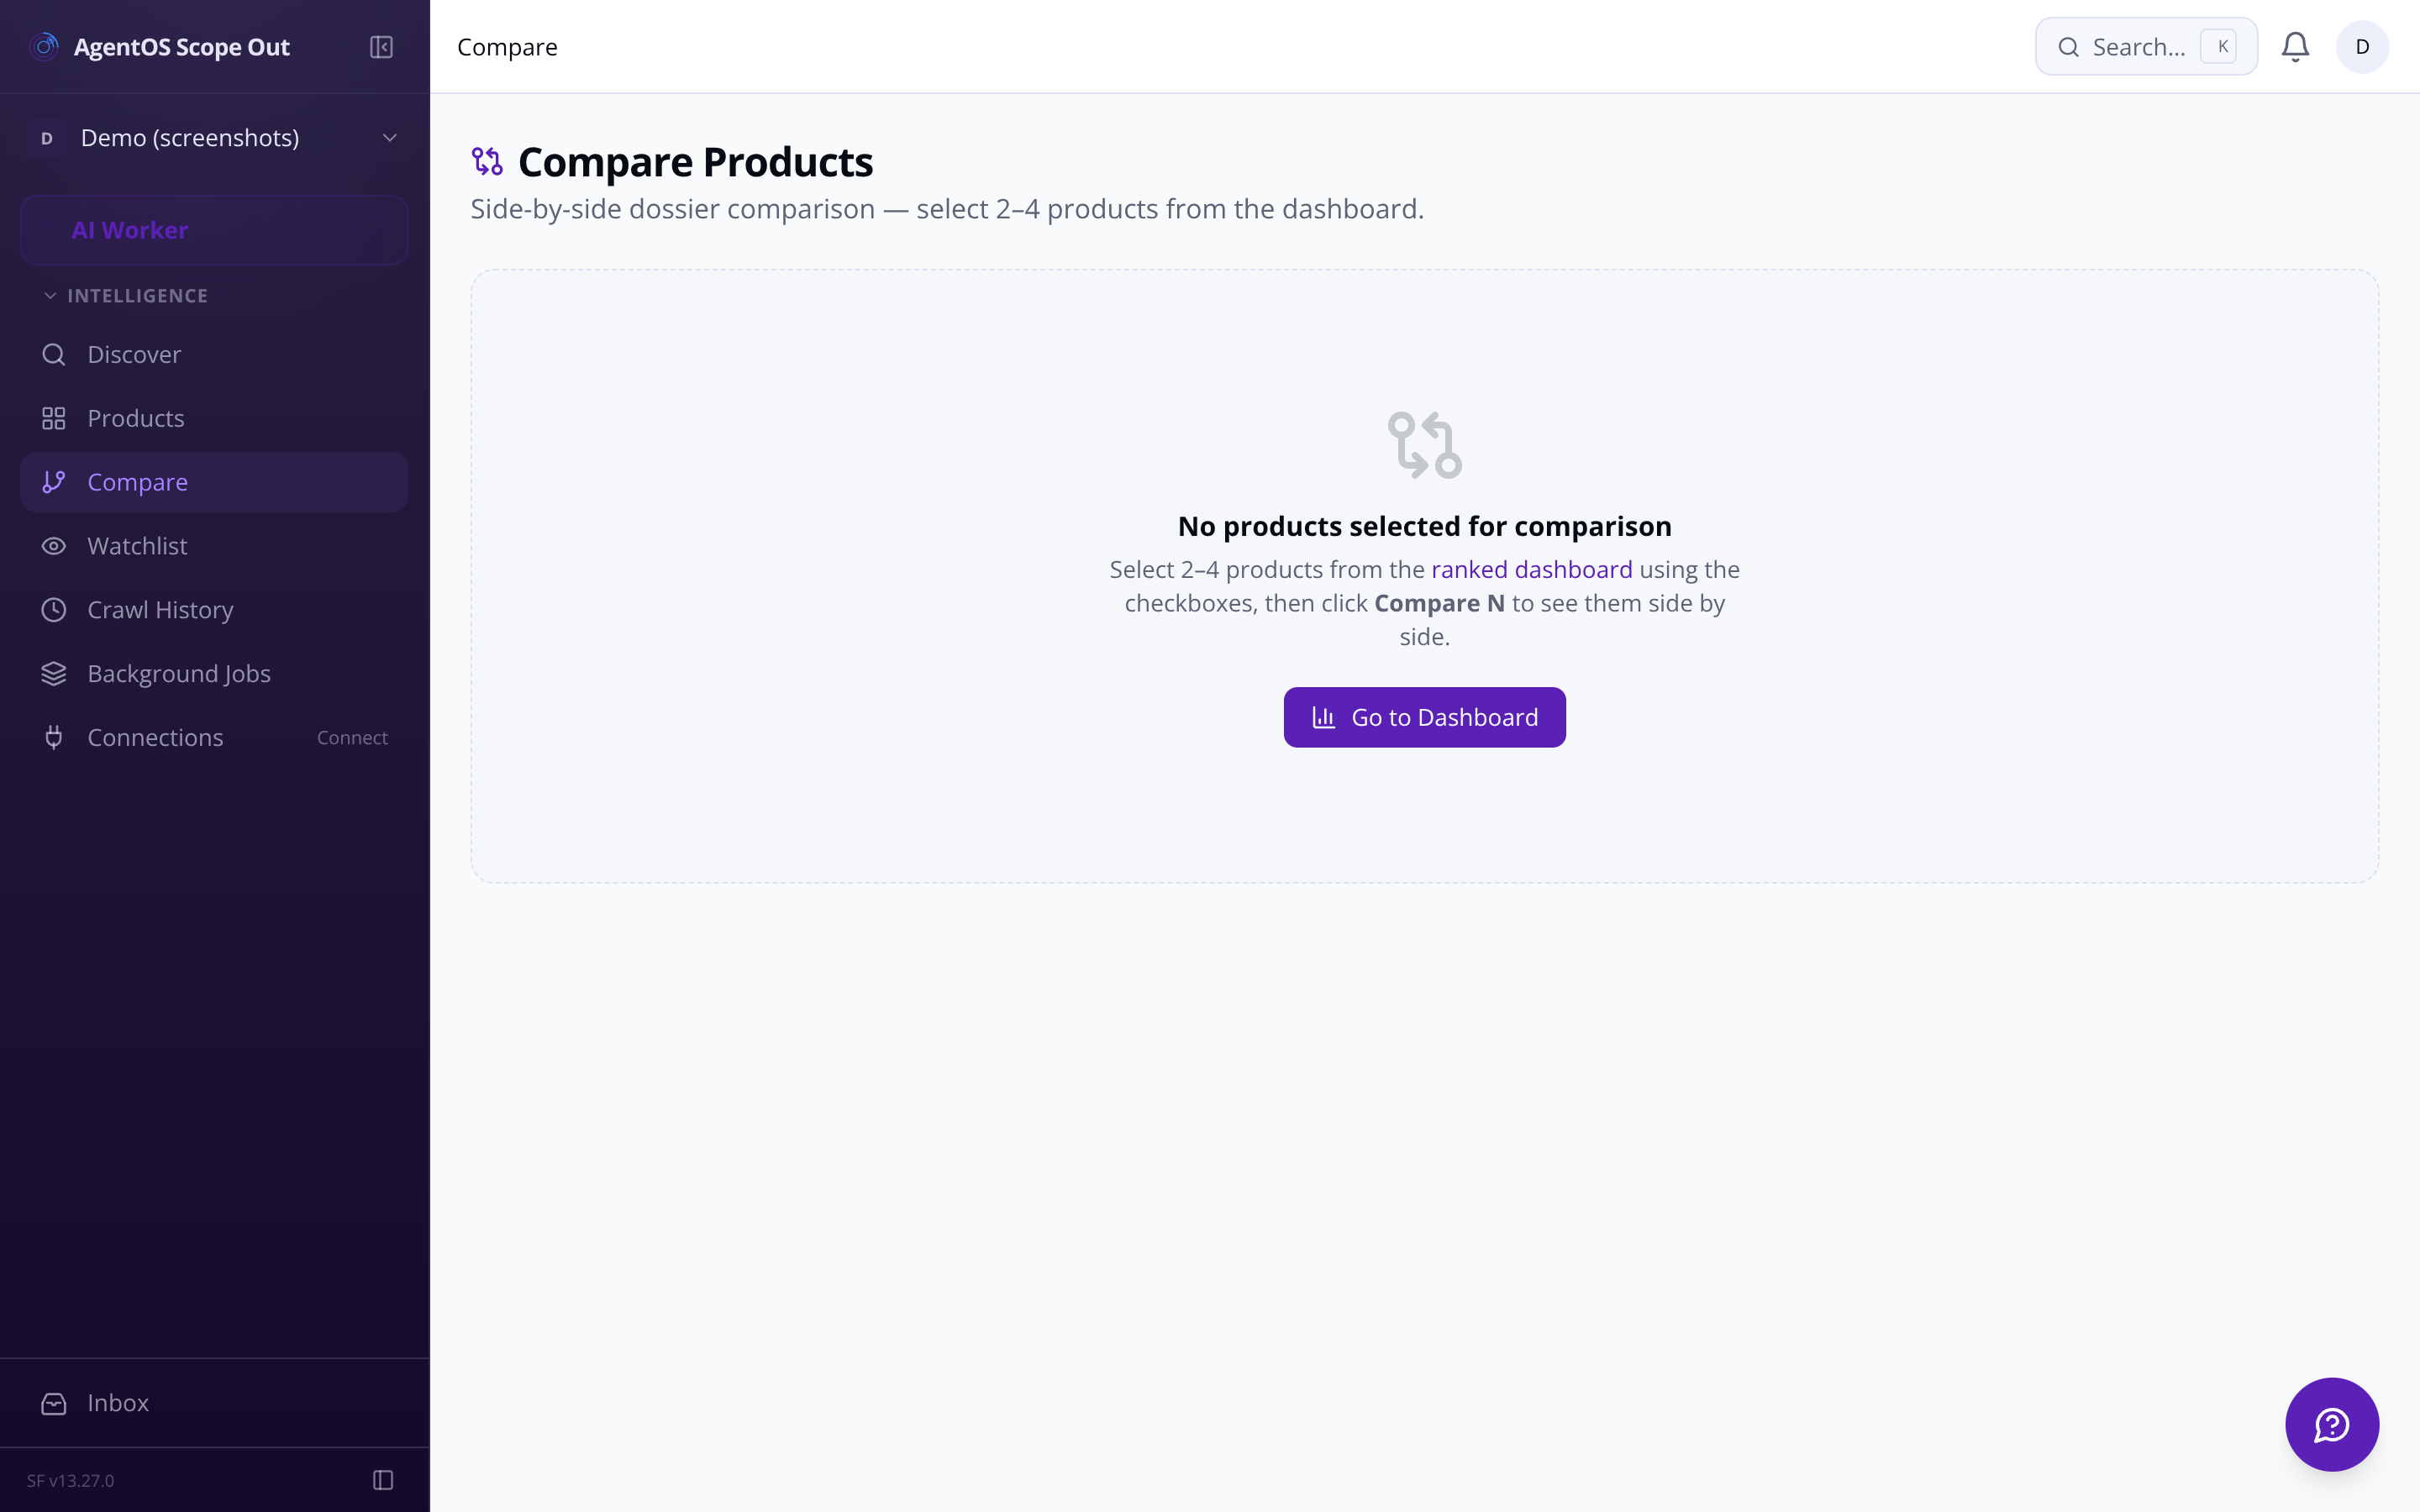
Select 2–4 products from the ranked table and open a comparison view: all four dimension scores, pricing tier, review count, and top weakness themes aligned in columns. When two products score similarly, the detail that separates them is usually visible here.
[ DOSSIER / OUTPUT ]
The AI dossier generator produces three structured outputs per product — ready to paste directly into the SaaS platform builder.
A concise positioning statement for a competing SaaS — framed around the gaps in the existing product's negative reviews.
Suggested features ordered by market gap size — what the market is asking for that the incumbent doesn't deliver.
[ PIPELINE / BACKGROUND JOBS ]
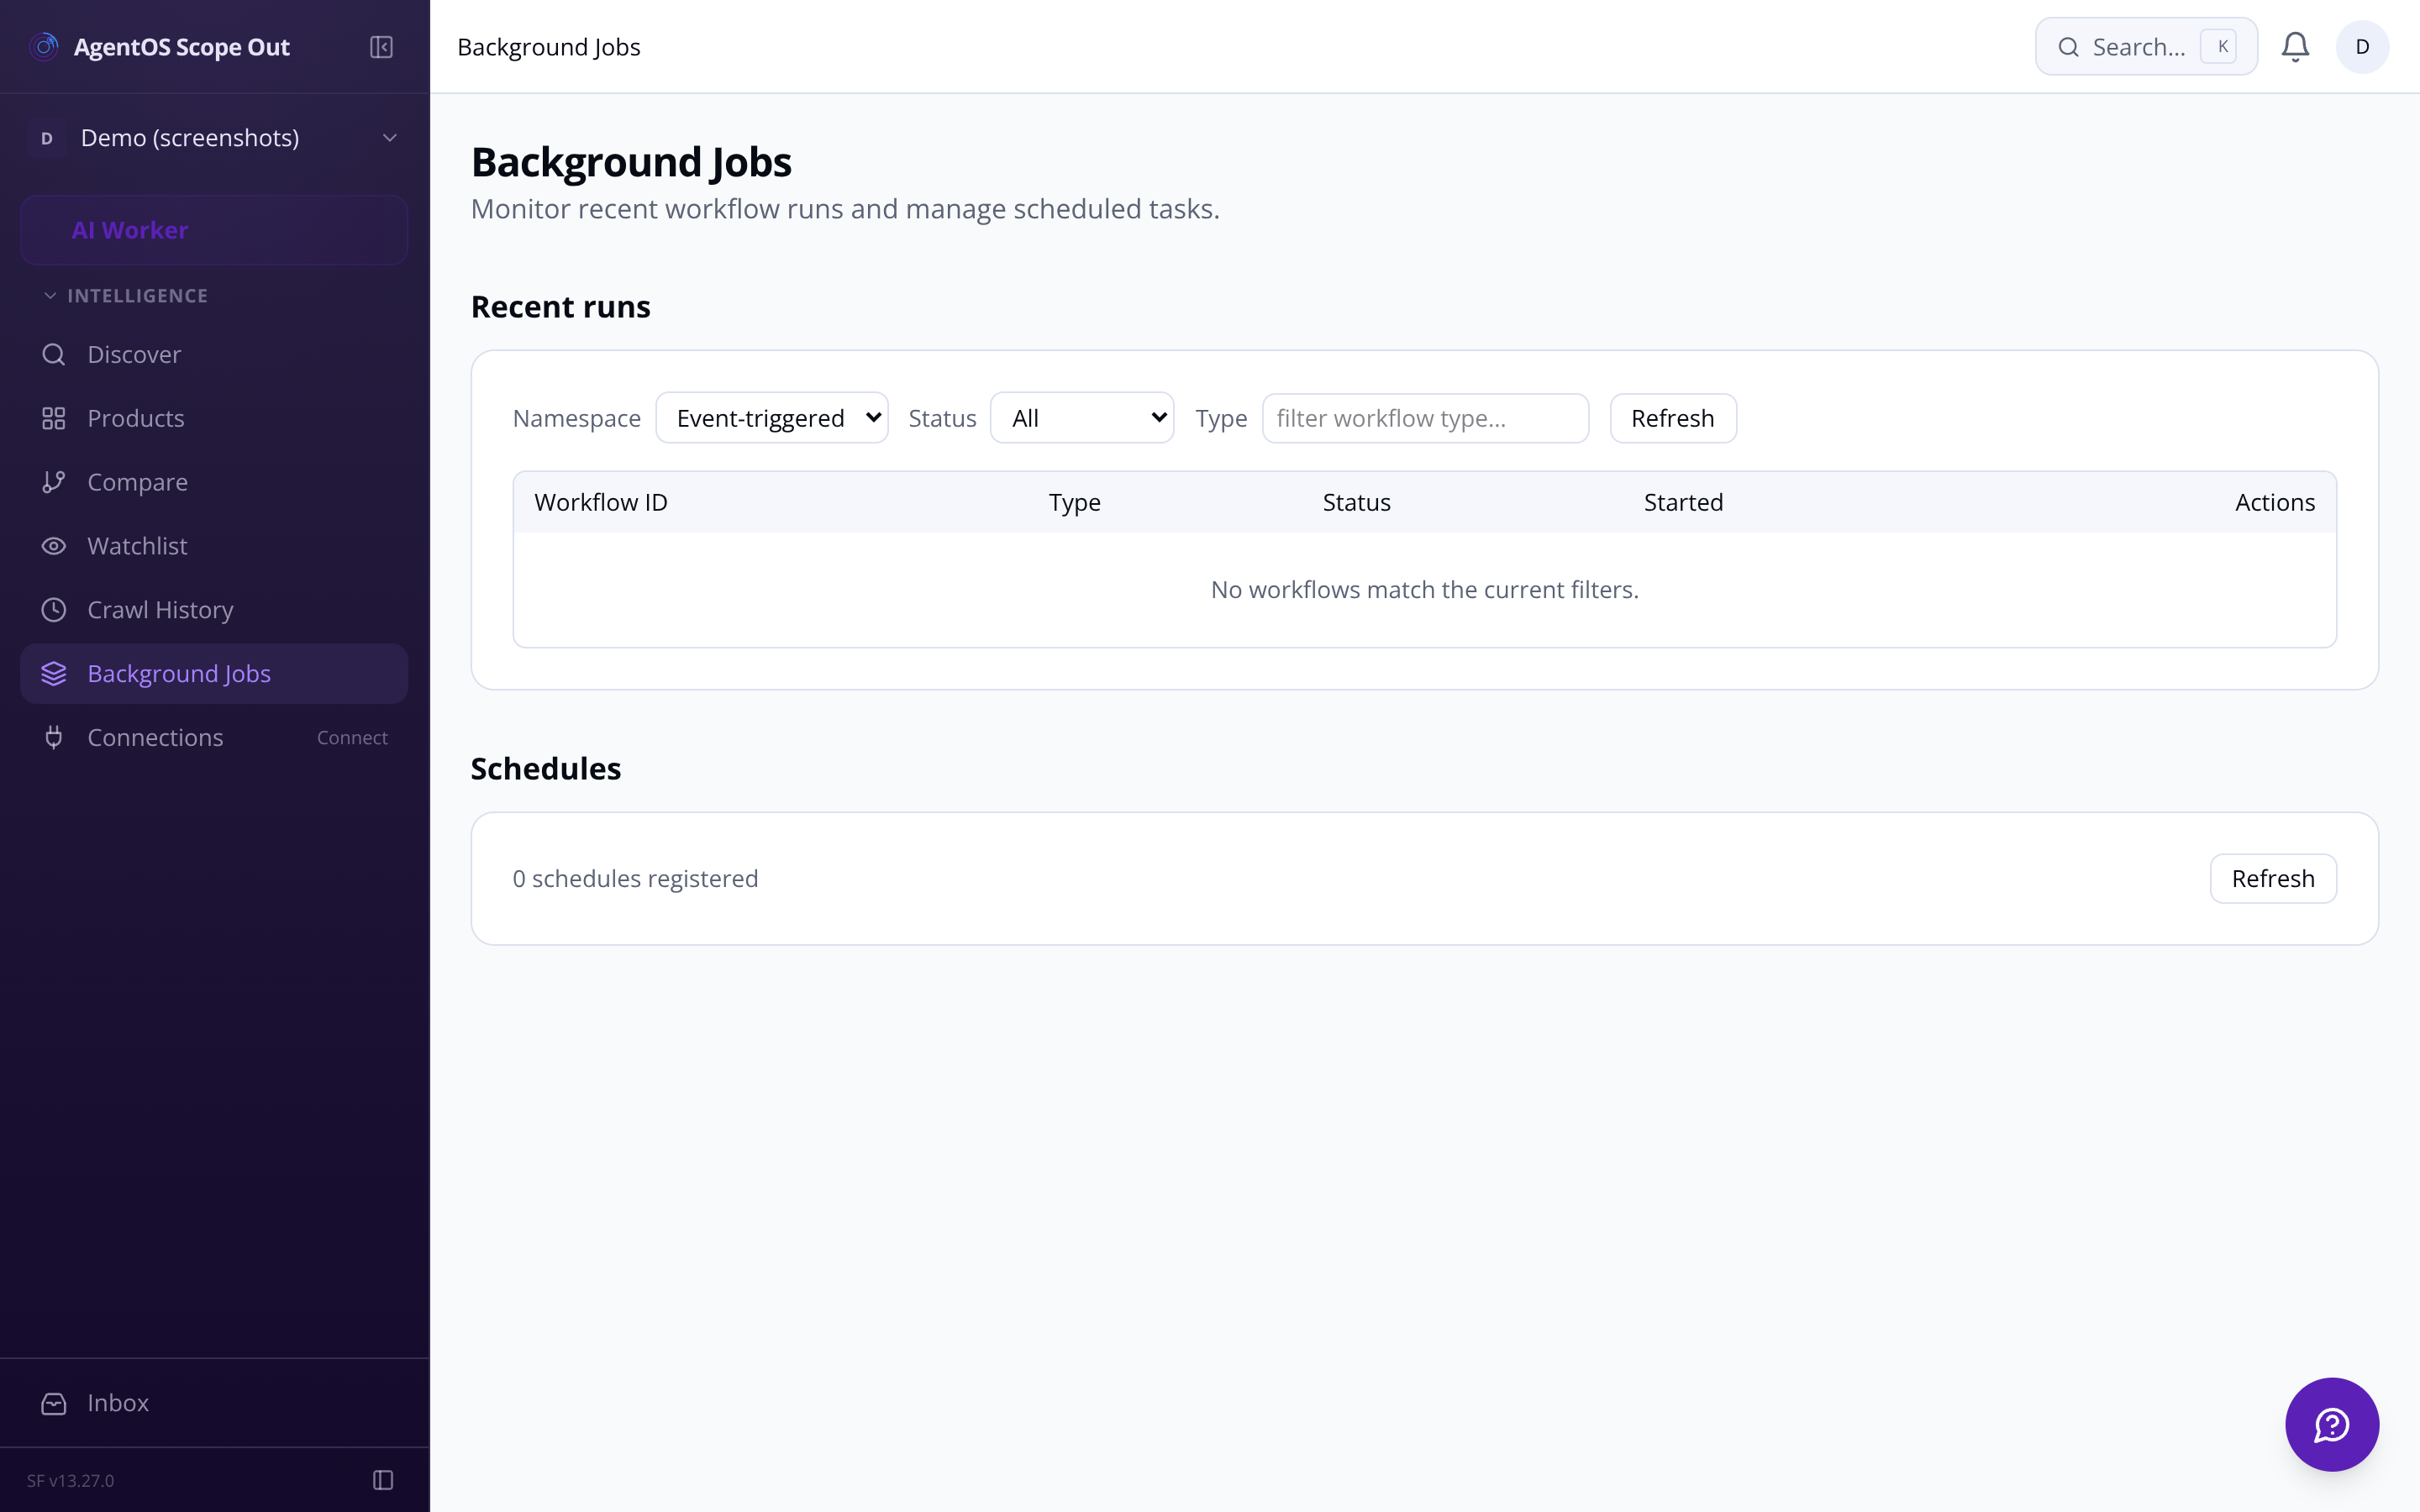
The pipeline status panel shows real-time progress across every stage of a crawl run: listings discovered, products deep-scraped (X/Y), scored (X/Y), dossiers generated (X/Y). When scraping fails — 403 blocked, timeout, no reviews — the error is surfaced with status code and detail, and individual products can be retried without re-running the whole batch.
Crawl history & run log Every past run logged: URL, timestamp, products found, score count, duration, status. Click a run to see exactly which products came from it.
Bulk re-score Checkbox-select up to 50 products and trigger a batch refresh — scrape + re-score — tracked in the status panel.
AI cost tracking Token usage and estimated cost tracked per crawl run — skim, scoring, dossier generation broken out. In-app alert if a single run exceeds a configurable threshold.
[ SETTINGS / CONFIGURATION ]
Adjust the relative weight of each scoring dimension. Stored per-org. Weight changes trigger background re-ranking — no AI re-run required.
Replicability, market demand, revenue potential, and competitive gap shown per row. No aggregation that hides signal.
Search across product names, descriptions, and dossier content. Filters persist in URL so the whole team works from the same view.
▲/▼ directional badges show when a product's composite score moved more than 1.5 points between crawl runs.
Competitive Gap (1–10) Top 3 recurring complaints from negative reviews mapped to opportunity themes: no mobile app, pricing too high, poor API — scored by frequency and severity.
Admins can adjust dimension weights from Settings — replicability 30%, revenue 30%, demand 25%, gap 15% by default. Changing weights triggers a background re-ranking without burning more AI tokens.
Representative workload shape — bars illustrative.
Dossier drill-down Click any product row to open its full dossier: scored dimensions with written rationale, raw review samples, pricing signals, and feature list.
Radar / bar chart breakdown Visual score breakdown on each dossier page — strengths and weaknesses at a glance without reading every number.
Version history Every re-score persists the previous dossier as a snapshot. Track how a product's opportunity has shifted across crawl runs.
Three recurring complaint themes from negative reviews, mapped to product opportunity categories and scored by frequency.
Each artefact has a dedicated Copy as Markdown button. Export the full dossier as a formatted PDF or Markdown file from the same page.
Scheduled re-crawl Mark a directory as monitored; a weekly cron re-crawls it and badges newly discovered products in the dashboard.
Admin-editable lookup table mapping each PropTech category to estimated UK/global ARR and growth rate — the foundation of revenue potential scoring.
Configure how long raw scrape data is retained (default 90 days) and the minimum interval before a product is re-scraped (default 7 days).
Add and manage crawled directories with per-directory crawl frequency — one-off, weekly, or monthly. Last crawl date and product count visible at a glance.
Set a per-run cost ceiling. In-app notification fires if a single crawl run's AI spend exceeds your configured limit — default $5.
